P1Analysis v2 - 2018 FIA WEC 24 Hours of Le Mans Race
P1Analysis v2, is a reports subscription service that has been helping IMSA team drivers, engineers, strategists, since 2016. Over the next few months, we'll be working on making P1Analysis available to FIA WEC competitors as well!
Please enjoy these complimentary reports from the 2018 24 Hours of Le Mans Race. Within each of the classes, we examine a different P1Analysis v2 chart. Click on the P1Analysis v2 links to experience each of the interactive reports.
To find out more about our products and services or to contact us, click here.
|
P1Analysis v2 - LM P1
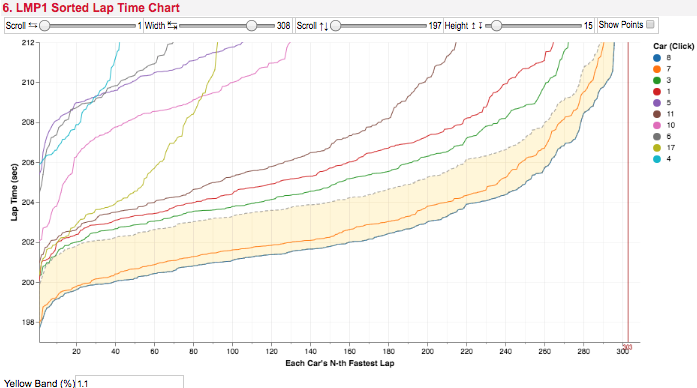
The Sorted Lap Times chart arranges and plots each car's N-th fastest lap times from left to right - the each car's first fastest lap time is plotted at x=1, their 2nd fastest lap time at x=2, etc. This sorted visualization allows us to see the capability of the car and its drivers during the session. We see the winning #8 Toyota Gazoo Racing LM P1 hybrid defining the entire N-th fastest lap envelope (lower edge). Only the sister #7 car is close, but we see via this comparison the two never cross over each other. We increase the height of the yellow percentage-slower-than envelope band (lower left) to see that the #3 Rebellion R-13 is more than 1.1% slower than the #8, quite a gap if used as part of the BoP equation. Look at chart 4 Lap Time Box Plot by Driver and see who the fastest driver was. |
|
|
P1Analysis v2 - LM P2
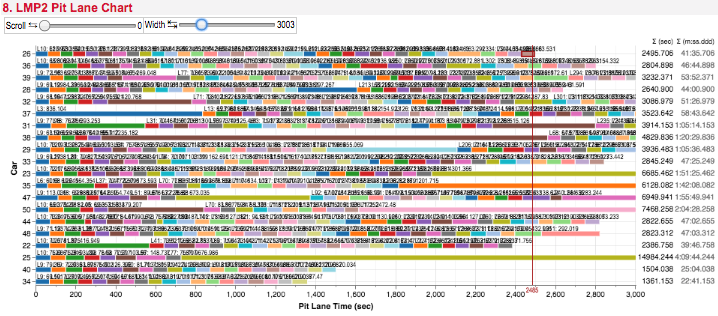
The Pit Lane Chart shows each car's pit stops as a stacked bar chart. All of the N-th pit stops are color coded the same, allowing you to quickly compare corresponding stops among cars. Although the #26 G-Drive Racing and sister #28 TDS Racing ORECA 07 Gibsons are shown as finishing 1st and 4th, the FIA have disqualified both cars for "non-compliance of a part in the fuel restrictor", but the competitor intends to appeal the provisional results. In the chart on the right, we do see their total pit times of 2495 and 2640 seconds being shorter than their immediate competitors. According to Racer, "post-race inspection found an additional part had been inserted into the ‘dead man’s handle’ element of the fueling rig which inspectors concluded had been designed to defeat the purpose of the mandated fuel fill restrictor." |
|
|
P1Analysis v2 - LM GTE Pro
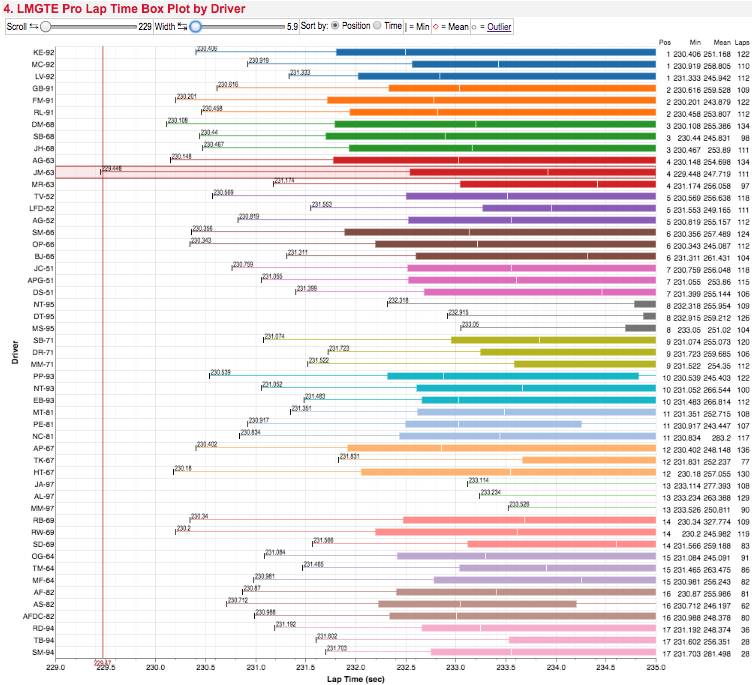
The Lap Time Box Plot by Driver allows us to see the distribution of each driver's lap times. The default Sorts each row by the car's finishing Position, allowing you to compare co-drivers. You can also Sort by each driver's fastest lap Time. Jan Magnussen has the fastest LM GTE lap time in the race in the #63 Corvette Racing entry. Tony Kanaan in the #67 CGR Ford GT and Scott Dixon in the #69 car did not complete the mandated drive times in their cars. We can see from the column data that they drove 77 and 83 laps respectively and had the slower fastest lap times in their cars. |
|
|
P1Analysis v2 - LM GTE Am
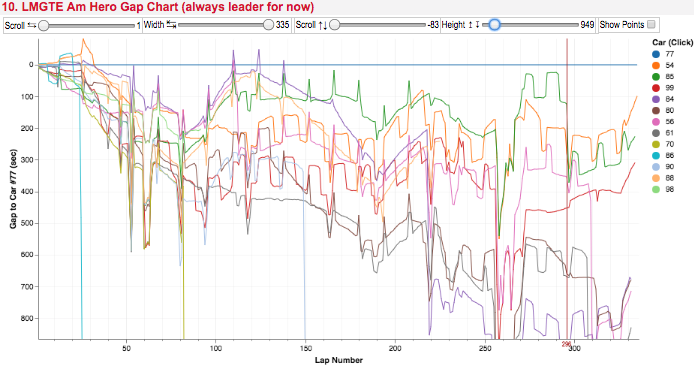
The Hero Gap Chart plots the gaps between a hero car (e.g., the race leader) and each competitor over the course of the race. Thus the hero is always represented by the y=0 horizontal line. We see #77 Dempsey - Proton Racing Porsche in the lead for most of the race. The #68 Keating Motorsports Risi Competizione-run Ferrari was in a close second during the latter portion of the race until a lap 296 (red vertical rule) off. In the last few laps, we see several cars start to close the gap to #77, indicating that the #77 slows down. This can be verified by isolating (clicking) on car #77 in the Lap Time Chart. |
|
P1Analysis v2 - 2018 FIA WEC Le Mans Test Session
Please enjoy these complimentary samples from the 2018 Le Mans Test Session. Within each of the classes, we examine a different P1Analysis v2 chart. Click on the P1Analysis v2 links to experience each of the interactive reports.
To find out more about our products and services or to contact us, click here.
|
P1Analysis v2 - LM P1
We can see from the Prototype Race Gap Chart, Fernando Alonso posted the fastest lap time, 3m 19.066s in the #8 Toyota Gazoo Racing LM P1 hybrid. Alonso also drove the second most number of laps, 40. However, when we examine the Classification chart (not shown), we see that it is the #7 Toyota that posts the highest Top Speed. |

|
|
P1Analysis v2 - LM P2
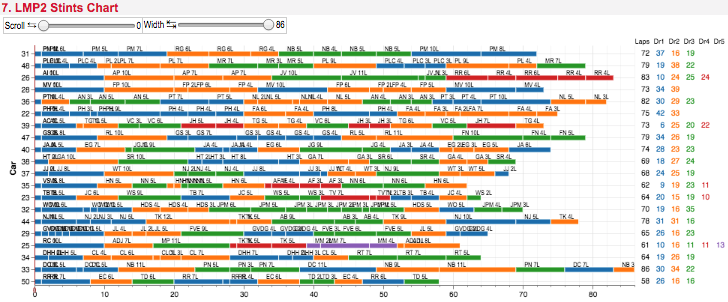
We can clearly see the driver sequences in the Stints Chart. While most teams had three drivers during the Test, Algarve Pro Racing's car #25 had five drivers. Jackie Chan DC Racing's #33 Ligier logged the most number of laps, 68. |
|
|
P1Analysis v2 - LM GTE Pro
The Sorted Lap Times chart arranges and plots each car's N-th fastest lap times from left to right - the each car's first fastest lap time is plotted at x=1, their 2nd fastest lap time at x=2, etc. This sorted visualization allows us to see the capability of the car and its drivers during the session. The two fastest GTE Pro cars are the #93 and #91 works Porsches. We see that the #93 Porsche posts the fastest lap, 3m 52.551s, but all its other laps are not close to this time. The #91 car's laps form most of the lower edge of the envelope - a winning pattern in a race. We see that the two #97 and #95 Aston Martin Racing cars are off pace and are hoping for a favorable BoP adjustment. |

|
|
P1Analysis v2 - LM GTE Am
A traditional numeric Classification table gives a quick overview of many aspects. |

|